A risk decomposition walkthrough
This is a method I’ve used to help frame and model cybersecurity risks over the past few years. It helps organize a lot of complexity when dealing with a large organization.
This method uses forecasts, scenarios, multiplication and addition. As all risk modeling goes, this has more to do with the journey of collecting risk knowledge in a rigorous way. We’ll discuss it’s weaknesses at the end.
1. Create a scenario.
This walkthrough will use the following scenario:
We disclose ≥1 incidents with ≥$10M damages in 2021.
What future outcome are you looking to investigate? Be confident about your definitions. This example mentions damages and an incident: What damages count? What is an incident, specifically? Disclose where, or to who? Who judges whether the event occurred at all?
2. Forecast whether it will happen or not.
Set the odds. You’re the oddsmaker! If people were betting on this event, what odds are fair? Here’s an example: A 14% chance that this scenario will take place in 2020.

It’s not super important to be right at this phase. You can finish this exercise with any number here. In the future, you can score this forecast if you want to take it further.
3. Consider: How did it happen?
Brainstorm! What categorical areas might cause the incident? A disclosable incidents could happen in a variety of ways. How would you categorize the possibilities?

Make each category mutually exclusive and collectively exhaustive (as much as possible). Here is an example:

Each node is an additional condition on the original scenario (making it lengthier). Sometimes the scenario becomes a mouthful.
For instance: We disclose a compromise in our IT assets with ≥$10M damages in 2021.
This, of course, is more specific and narrow than our original scenario. Or original scenario accept any incident across the organization, but this node only accepts incidents arising from an compromise in IT. Categorize them similarly!
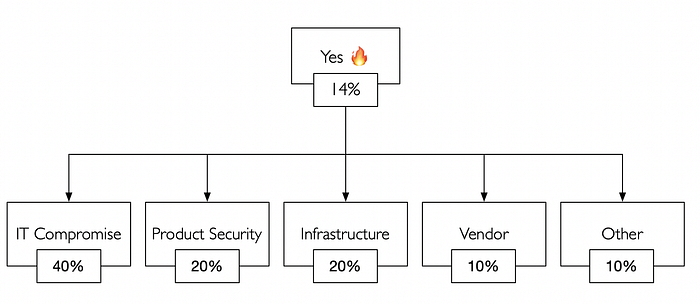
For our example, the following were chosen… with “Other”.
- IT compromises
- Product security failures
- Infrastructure failures
- Vendors
- Other gives us a catch-all for errors: incidents that weren’t considered or difficult to classify. Do your best to pick categories that are unlikely to intermingle in an incident. This can be difficult. But, in the event that something is too difficult to classify — it’s Other.
4. Forecast… (again)!
If this incident were to occur, what odds would you set on the incident being classified (or judged) as belonging to one of these categories? The sum of all categories must equal 100%. Here, our example has some forecasts dropped in. It looks like IT Compromise is the front-runner for causing an incident.
🚨 : The mental effort required for forecasting is where this method is valuable.
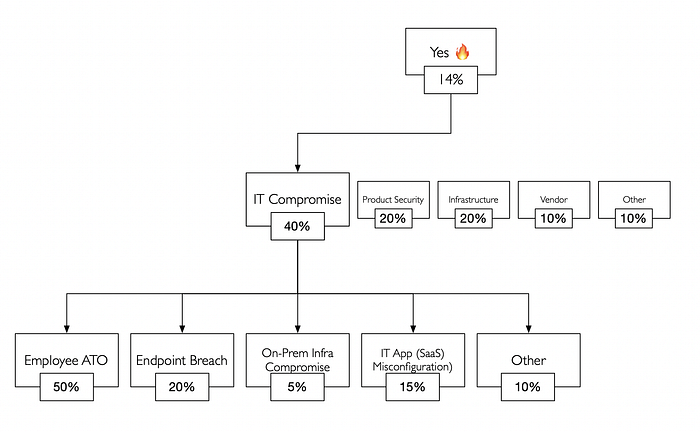
5. Consider, and forecast (AGAIN!)
This can be iterated and depth can be added repeatedly, but you might run out of time or energy. One level deep for each category is doable in a reasonable amount of time with a group.
6. Find the hotspots.
The above diagrams are helpful for learning this method. However, we would actually be calculating all of this in a spreadsheet. A simple sheet can quickly figure out how much risk each category holds by decomposing Yes 🔥 (14%) by its potential causes.
For example, Yes 🔥 (14%) * IT Compromise (40%) * Employee ATO (50%) means the example forecasts 2.8% belief that the incident will be an ATO against an employee. Here’s an example spreadsheet, using conditional formatting to automatically highlight risk hotspots.
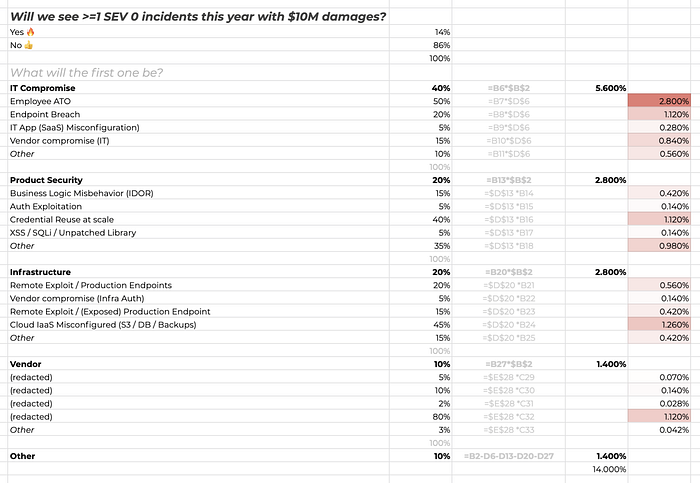
We can see, visually, that our forecast method has surfaced:
- Employee ATO: Perhaps, an employee’s single factor credentials being leaked and exploited.
- Cloud IaaS Misconfigured (S3 / DB / Backups): Maybe an S3 bucket being exposed after a configuration change.
- Credential reuse in our product / Endpoint breach / Vendor (three way tie): How is a single vendor as risky as a whole other category? Maybe worth discussing.
The exercise of building this model is generally more important than the output. But, the prioritization of these results should be confronted with the reality of how things are actually prioritized in practiced.
There are many reasons why prioritization would drift away from risk. Sometimes those reasons are good. Prioritization will rarely track with risks perfectly.
Regardless, this approach helps build a challenge against non-risk based prioritization, which might be a healthy sanity check.
At this point the journey is over. In risk modeling, the journey is the destination. The process of filling into a model, learning, debating, and questioning the gaps which makes us better knowledge workers as we pursue risk as a science.
BENEFITS ✅
This is a useful planning method. It is especially strong at capturing a very wide space of risk in a complex system, and prioritizing it. It allows us to get ankle deep into some lower risks, and deeper if we can delegate / collaborate.
The real benefits come from collaboration. Doing this exercise as a group is sure to surface differences and shake unwritten knowledge out of people.
Some common debates:
- Why do you think
Xis so likely? It’s not even possible. - I’m really surprised you expect
Yto happen more thanZ. - I thought we fixed
AandB, shouldn’t it be lower?
These debates force participants to share their knowledge and evidence. Follow up tasks spill out of these discussions in search of proof.
Breakdowns can be delegated to teams: For instance, product security can fill out their risks while another team fills out theirs.
Everyone perceives risk differently — in particular, people assess probabilities in strange and dangerous ways. This method (especially with team / panel) helps smoothen those errors out between ourselves with conversation and confronting differences with more granularity than 🔴 🟡 🟢 approaches. Risk panels are found in multiple industries to help alleviate cognitive issues around risks and biases.
PROBLEMS ❌
There are many! First, this is a risk modeling method. It does not solve for risk, despite the fact that numbers are used. All models are wrong. This, instead, forces the operator to confront their beliefs and expose them to scrutiny.
Models tend to pick where they will allow error in how they are designed. All models sacrifice some fidelity for simplicity. Here’s where this model suffers from those tradeoffs:
The first area is the fact that we’re only predicting the first incident in what could be many incidents in a certain timeframe. Users of this model would assume that predicting the first animal to walk out of Noah’s Ark does not mean there’s only one animal to work out of the Ark. Instead, this method simplifies the problem to approximate the possibilities of what could be inside.
Next, is the belief that we can actually create simple, mutually exclusive, and collectively exhaustive categories. We cannot make them truly exclusive and exhaustive. An real wacky incident could involve IT intrusion could result in an infrastructure compromise because of a simultaneous vendor intrusion.
This problem exists in most other modeling areas. We still model organizations around conceptually exclusive incident models knowing full well our organizational models are not perfectly representative of the problems they solve. We know error exists in simplistic models.
The Other category in this model is designed to alleviate this issue. It captures the forecasted belief of wacky, unexpected, black swan events that defy the model. Luckily, our community in security is generally happy to admit that our failures have been pretty categorical over the last decades. “Sophisticated” attacks always end up in neatly packaged categories with rare surprises.
Next, our scenario might not capture the undesirable event that eventually happens. Our example requires “disclosable” issues. What if a disaster happens that isn’t necessary to disclose? Would it have evaded our planning exercises?
Lastly, this does not track small improvements over time by adjusting causes. For instance, eliminating all vendors might not reduce Yes 🔥 by 10%. Rather, it would cause another forecast with the new information, which might increase other causes while also spilling over into No.
Ryan McGeehan writes about security on scrty.io